Part 3 | Beyond Financial Hedging: The Case for Physical Supply Resilience
Tristan Springer · February 2026 · 7 min read
In Part 1, we modeled what would have happened if biochar had been deployed to West Africa's most drought-exposed cocoa zones before the 2024 crisis. A $15M deployment could have generated $13.8M in protection value in a single crisis year. In Part 2, we ran the same analysis on coffee in Vietnam and Brazil, and found roughly double the returns, $27–28M cumulative over a decade, driven by coffee's higher crop values and flowering-window sensitivity.
The agronomic case is strong. But agronomic models don't close deals.
Who Actually Pays When Supply Fails
The damage from a supply crisis doesn't land evenly across the value chain. Brands like Nestlé and Mars feel it. They raise prices, shrink packages, take PR hits. But they also have the scale to hedge with derivatives, invest in their own long-term sourcing programs, and absorb higher costs without existential risk. Nestlé is already deploying CHF 1 billion into its own regenerative agriculture program.
The real pain sits with the traders in the middle. When Ghana's Cocoa Board couldn't deliver 334,000 tonnes in 2023/24, it was Cargill, Olam, and Barry Callebaut holding contracts they couldn't fill. When Brazilian coffee farmers defaulted on delivery (Volcafe alone had problems with roughly 5% of its Brazil book) it was the traders scrambling for replacement volume at crisis spot prices while still owing delivery downstream. In Colombia, up to one million bags of coffee went undelivered.
Traders operate on 3–5% gross margins. A 5% farmer default rate during a crisis year, with replacement sourcing at 60%+ spot premiums, can wipe out an entire season's margin. And the defaults come in two forms: farmers who literally can't deliver because the crop failed, and farmers who choose not to deliver because spot prices have spiked so far above their contract price that the penalty for default is cheaper than the upside of reselling. Both are devastating, and both stem from the same root cause: fragile supply in climate-vulnerable regions.
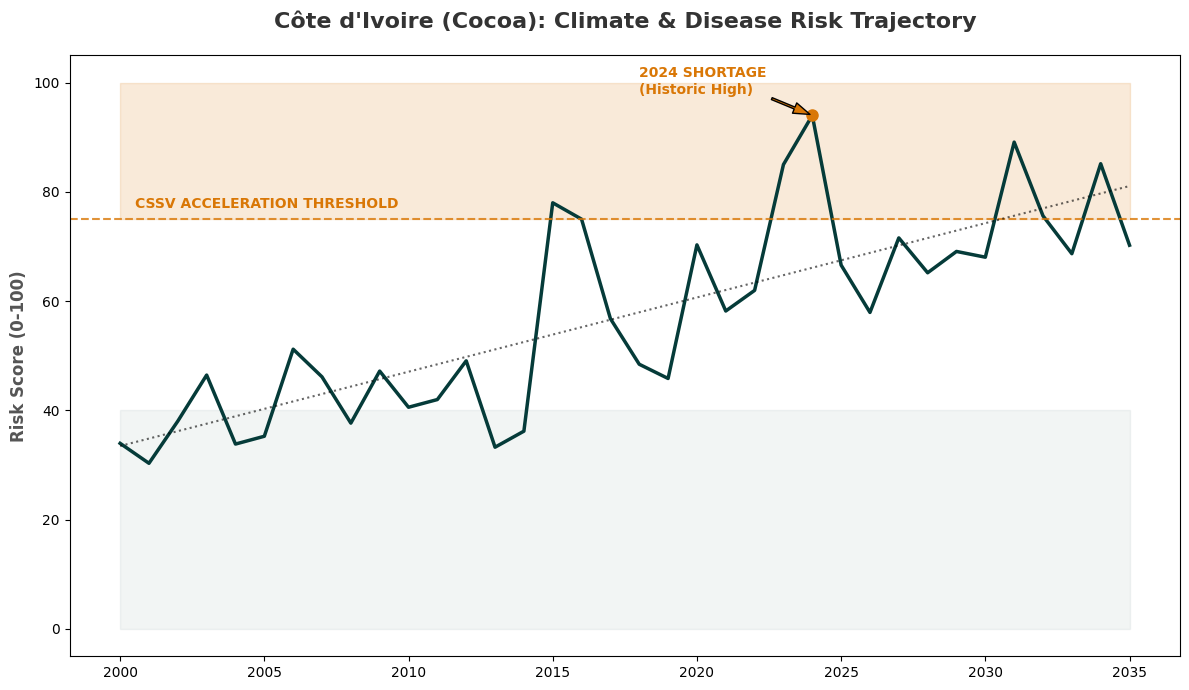
From Part 1: What used to be a 1-in-10-year drought is projected to become a 1-in-3-year event by 2035. The default problem isn't going away. It's accelerating.
Why Financial Hedging Doesn't Solve This
The standard playbook for managing procurement risk has two moves: lock in prices with futures and options, or accept spot exposure and absorb the hit. Both are well understood. Neither addresses what happened in 2024.
Futures and options protect against price volatility on contracted volume. They do nothing when the physical supply isn't there. Nestlé's derivatives portfolio amounts to less than 2.5% of cost of goods sold, and even with that sophistication they still raised consumer prices and reduced package sizes when the crises hit. For the mid-market traders who actually source and deliver the physical commodity, the exposure is far worse.
| Strategy | What it protects | What it doesn't |
|---|---|---|
| Financial hedging (futures, options) | Price volatility on contracted volume | Physical shortfalls, farmer defaults, yield loss, quality degradation |
| Spot procurement | Flexibility to buy when needed | Costs spike during supply shocks; volume may not exist at any price |
| Physical resilience (soil & farm investment) | Yield stability, drought buffer, supplier reliability | Not a direct price hedge (but reduces the conditions that cause price spikes) |
Parts 1 and 2 of this series quantified the third row. Biochar-amended soils maintained 357 kg/ha versus 279 kg/ha on untreated sandy cocoa farms during the 2024 crisis. In coffee, the flowering-window protection was even more dramatic. A few days of soil moisture during flowering is the difference between a full harvest and near-total loss.
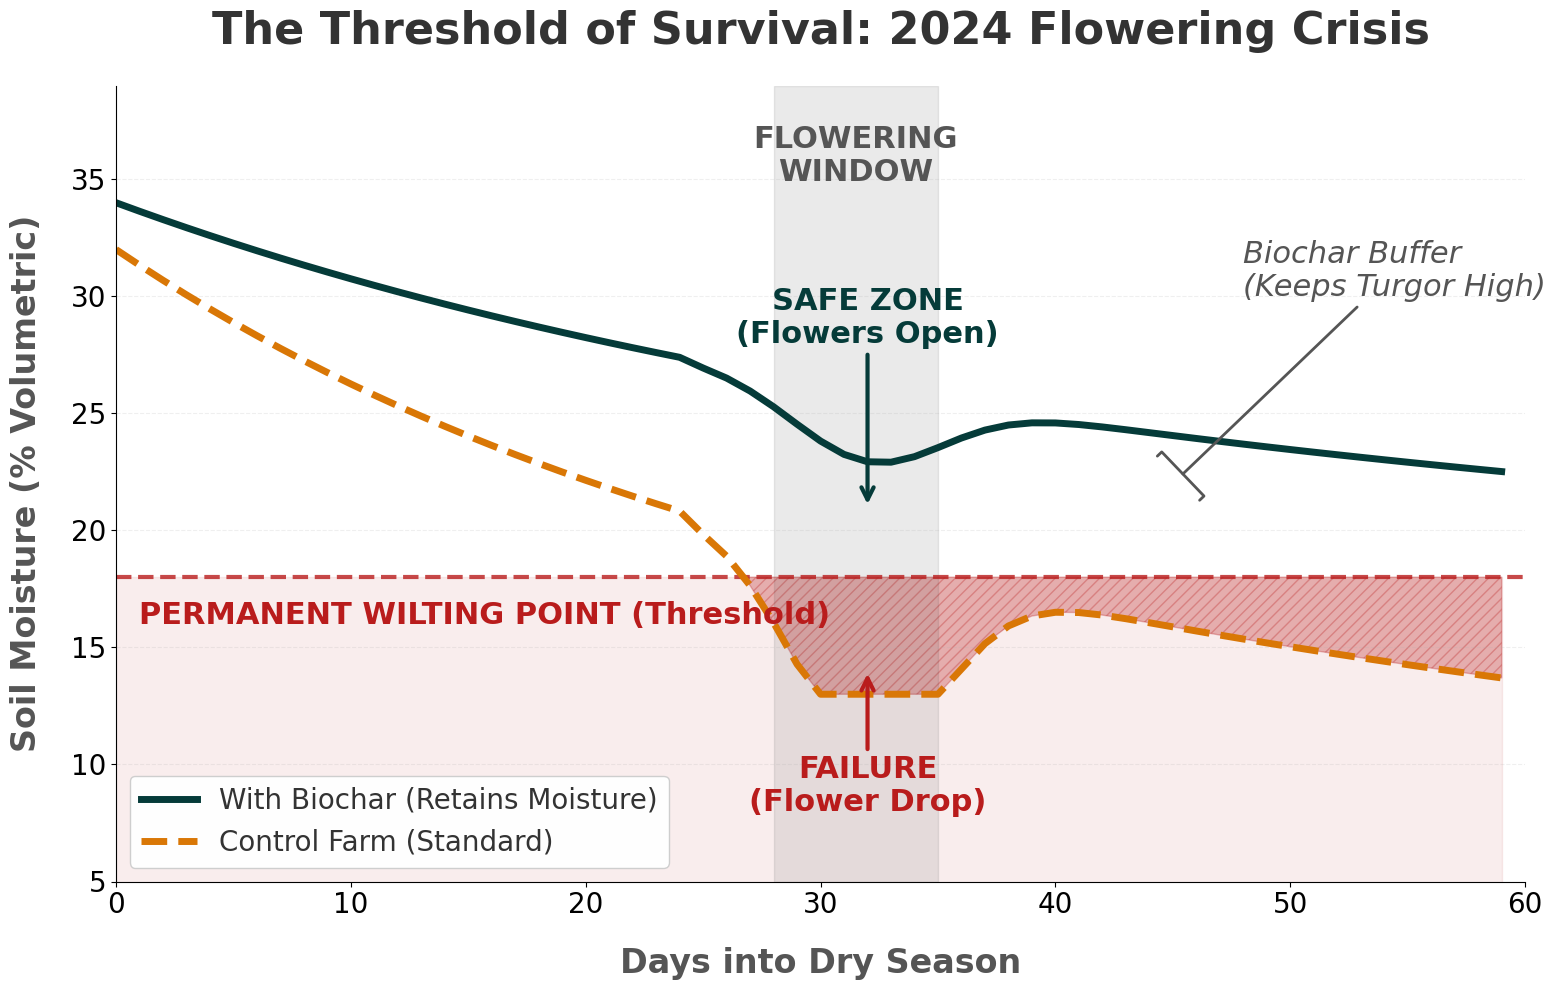
From Part 2: During the 2024 heat dome, control soils crossed the Permanent Wilting Point (triggering flower drop), while biochar-amended soils retained enough moisture to preserve the flowering window.
Financial hedges and spot procurement both operate downstream of the problem. They react to supply disruption after it happens. Physical resilience reduces the probability that disruption happens in the first place, and with it, the conditions that trigger both types of farmer default.
Identifying Where to Deploy
So if the case for physical resilience is clear, the question becomes operational: where do you deploy first, what does it cost, and how do you structure a program that makes economic sense?
The modeling in Parts 1 and 2 showed that resilience value concentrates in specific zones: sandy soils in West Africa's cocoa belt, fast-draining Cerrado soils in Brazil's coffee expansion corridor, depleting aquifer zones in Vietnam's Central Highlands. Deploying everywhere is neither necessary nor economical. The leverage comes from identifying the 5–15% of your sourcing footprint where climate exposure, soil vulnerability, and economic value intersect, and concentrating investment there.
That's the infrastructure we've built at Valorize. The platform lets traders and brands map their sourcing regions across coffee, cocoa, and other tropical commodities, model drought exposure and resilience intervention scenarios, and see the economics of deployment, including per-tonne cost impact, premium pass-through modeling, and payback periods.
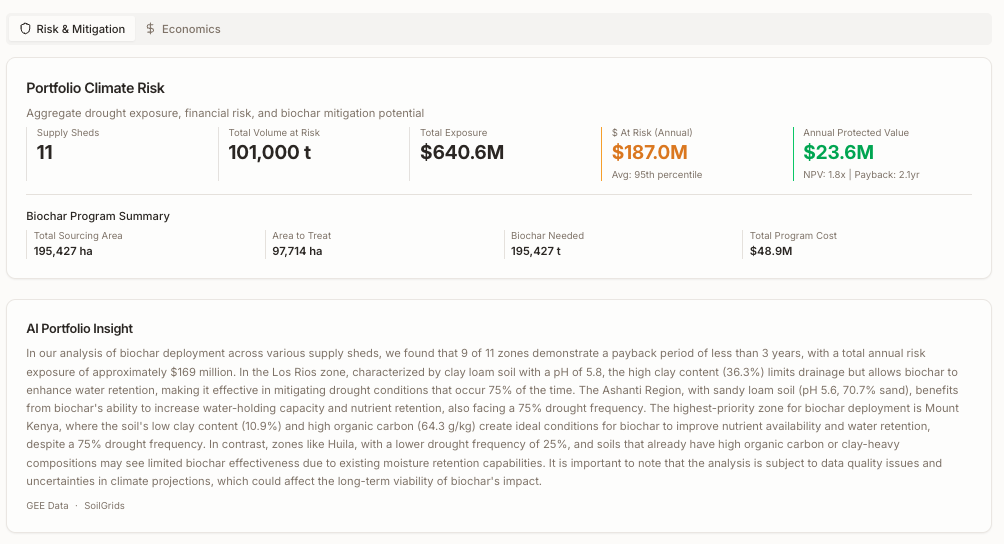
Portfolio Climate Risk. Built on ISRIC SoilGrids data and Google Earth Engine, layered with trader sourcing data to evaluate commodity risk exposure and protected value across origins. AI analysis models biochar effectiveness given exact soil types, precipitation patterns, and local agronomic context, so the output reflects what would actually work in each zone, not theoretical averages.
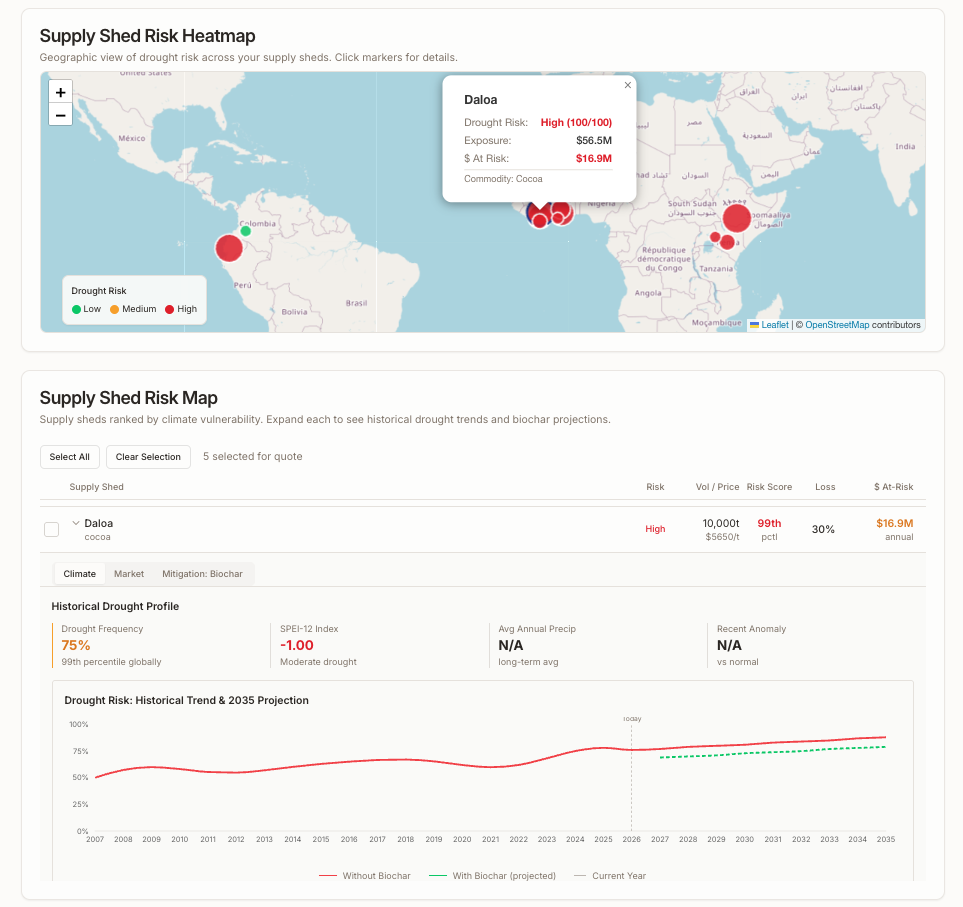
Supply Shed Risk Mapping. Heat risk trends at the supply shed level, showing how climate exposure is evolving across sourcing regions so traders can prioritize deployment before the next crisis, not after.
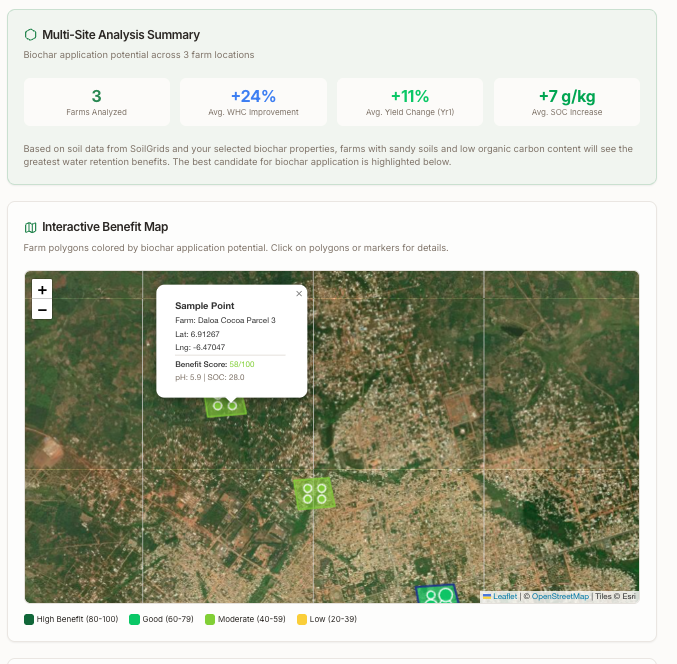
Agronomic Impact Analysis. Polygon-specific evaluation that digs deeper into expected results across water holding capacity, yield improvement, and nutrient efficiency, driving the overall impact analysis. Built for agronomists and traders to plan specifically which farms to deploy once an intervention is decided on.
The platform also lets traders evaluate program costs across different tiers, from biochar deployment alone, to adding field trials, to full programs that include carbon removals for Scope 3 neutralization.
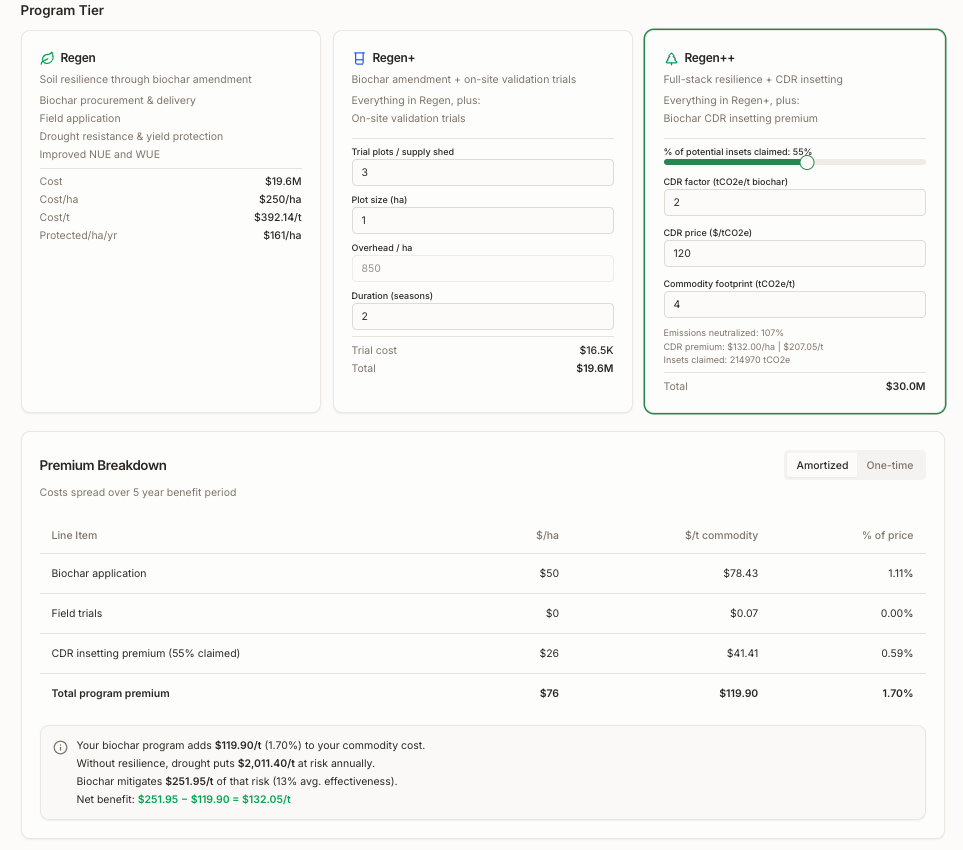
Program Tiers. Traders can evaluate potential program costs across three tiers: deploying biochar alone for resilience, adding trial costs to validate results, or including carbon removals to neutralize supply chain emissions. In this example, just 1.7% of commodity cost delivers resilient supply chains and 100% carbon neutralization via carbon-negative biochar (Scope 3 removals).
The Bottom Line
Across this series, we've shown that biochar can protect cocoa yields during West Africa's worst crisis in decades (Part 1), that the economics are even stronger in coffee where flowering-window sensitivity creates binary outcomes (Part 2), and that the tools to identify where, how, and at what cost to deploy exist today.
The gap in the market isn't knowledge. Everyone in commodity trading knows supply is getting more volatile. The gap is infrastructure: the ability to go from "we should do something about climate risk" to an actual deployment plan with economics that work for the trader, the farmer, and the downstream brand.
That's what we built. For less than 2% of commodity cost.
See the risk across your supply chain
Map sourcing regions, model resilience interventions, and see the economics in 15 minutes.