Part 2 | How Much Can Biochar Reduce Drought Risk? A Modeling Study
Comparing 2024 drought losses in coffee systems with and without biochar
By Devin Copenhaver, Head of Market Development at Valorize
Introduction
This is Part 2 of our series on biochar and drought resilience in tropical agriculture. In Part 1, we analyzed West Africa’s most drought-exposed cocoa zones and found that targeted biochar deployment would have materially reduced 2024 losses, nearly offsetting deployment costs in a single severe year.
Here, we apply the same approach to coffee in Vietnam and Brazil during the 2024 El Niño. The question: what if biochar had been deployed in Minas Gerais, Brazil, and Vietnam's Central Highlands before the drought?
The mechanics are similar to cocoa, with one crucial difference. Coffee trees typically survive drought—they don't die like cocoa trees can. Instead, the main risk is the flowering window, the brief period when trees produce flowers that become fruit. Just three to five days of intense heat or missed rainfall during flowering can wipe out an entire season's harvest. Our model tracks how soil conditions during this critical window determine whether farms produce a harvest or face near-total loss.
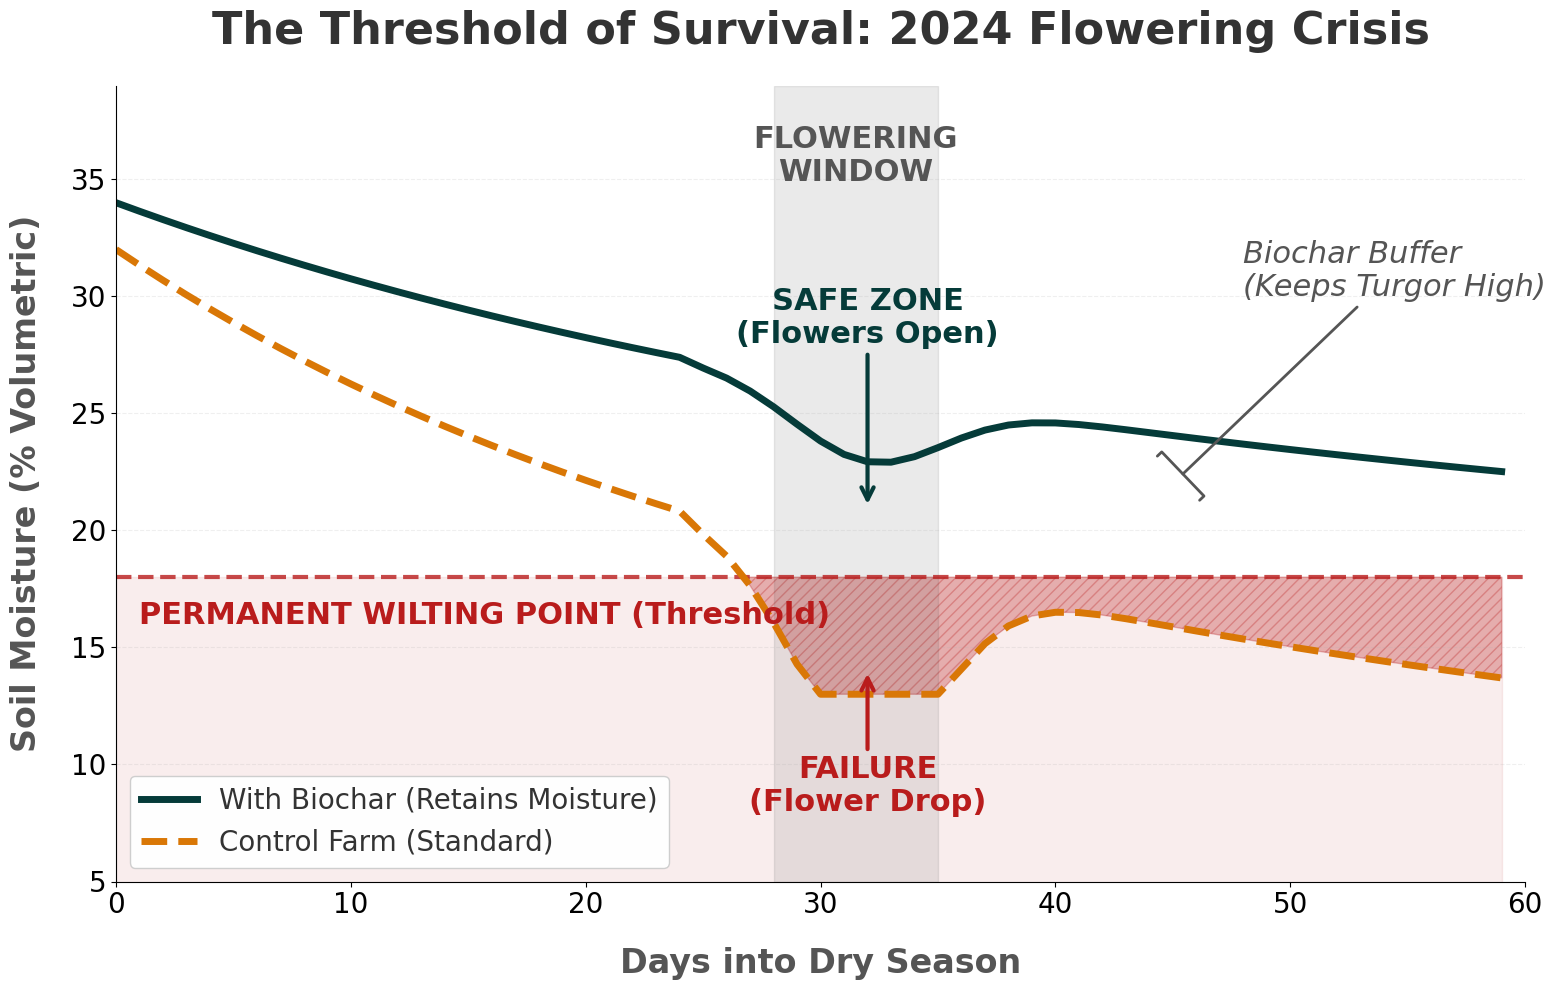
Biochar (green line) keeps soil moisture in the safe zone for longer. Our 2024 model simulates the impact of keeping crops above the permanent wilting point during the flowering window.
Where Coffee is Most Vulnerable
In Brazil's Minas Gerais region, Arabica cultivation is expanding onto sandy, fast-draining soils. These soils struggle to hold water during prolonged dry spells. Meta-analyses show biochar increases water retention by 20-25% in these sandy soils, creating a small reservoir around roots that allows trees to access moisture when they need it most.
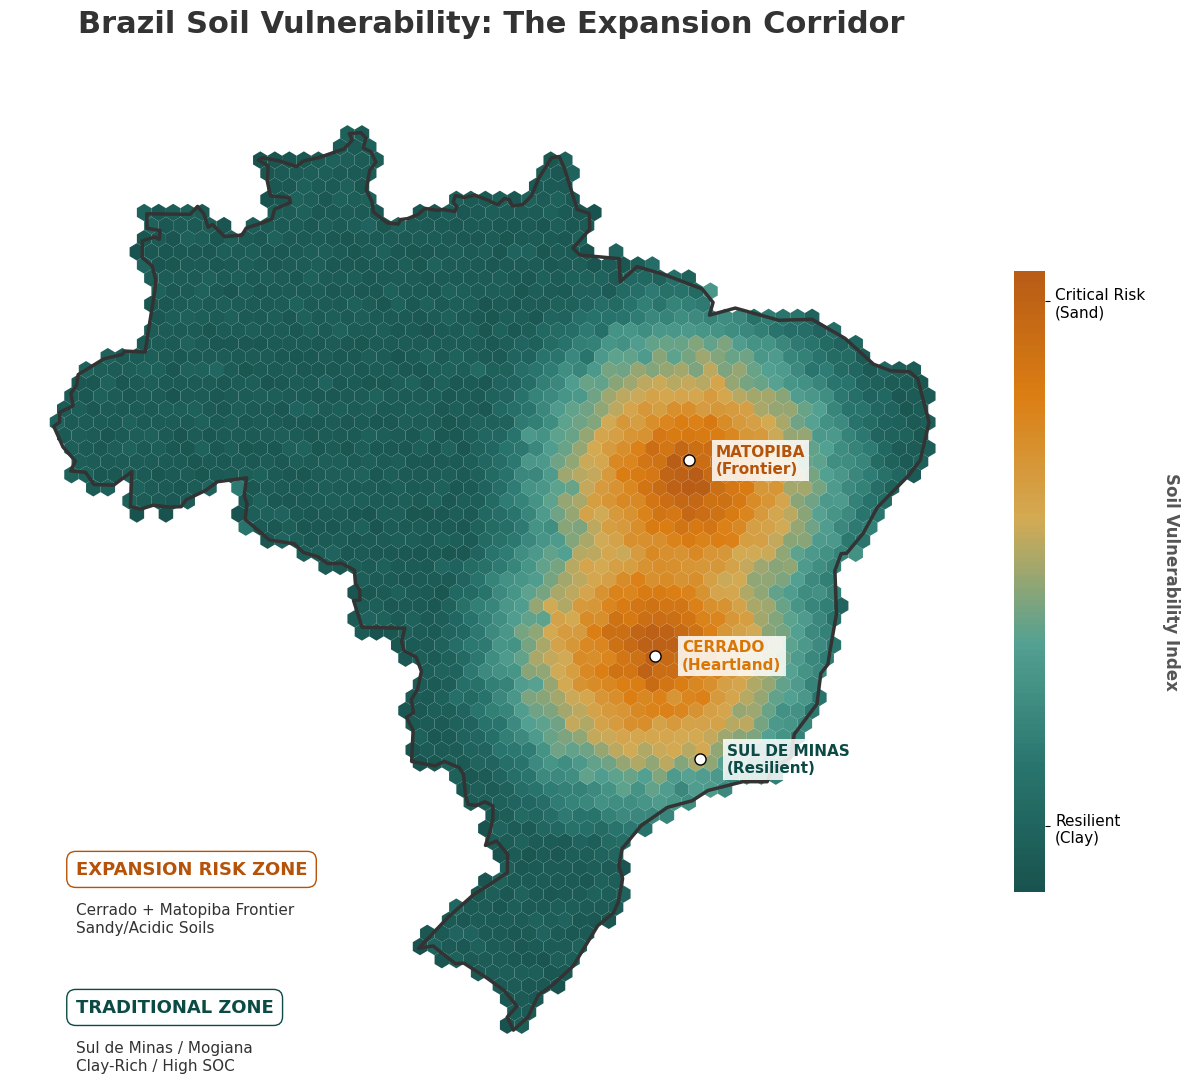
Gold zones indicate high-risk sandy/acidic soils in Cerrado and Matopiba where coffee production is expanding into areas particularly vulnerable to drought.
In Vietnam's Central Highlands, Robusta farms sit on clay-rich basalt soils. During extreme heat, these soils compact and crack, making it harder for roots to reach water. Biochar preserves soil structure under stress, maintaining pore space so roots can access moisture.
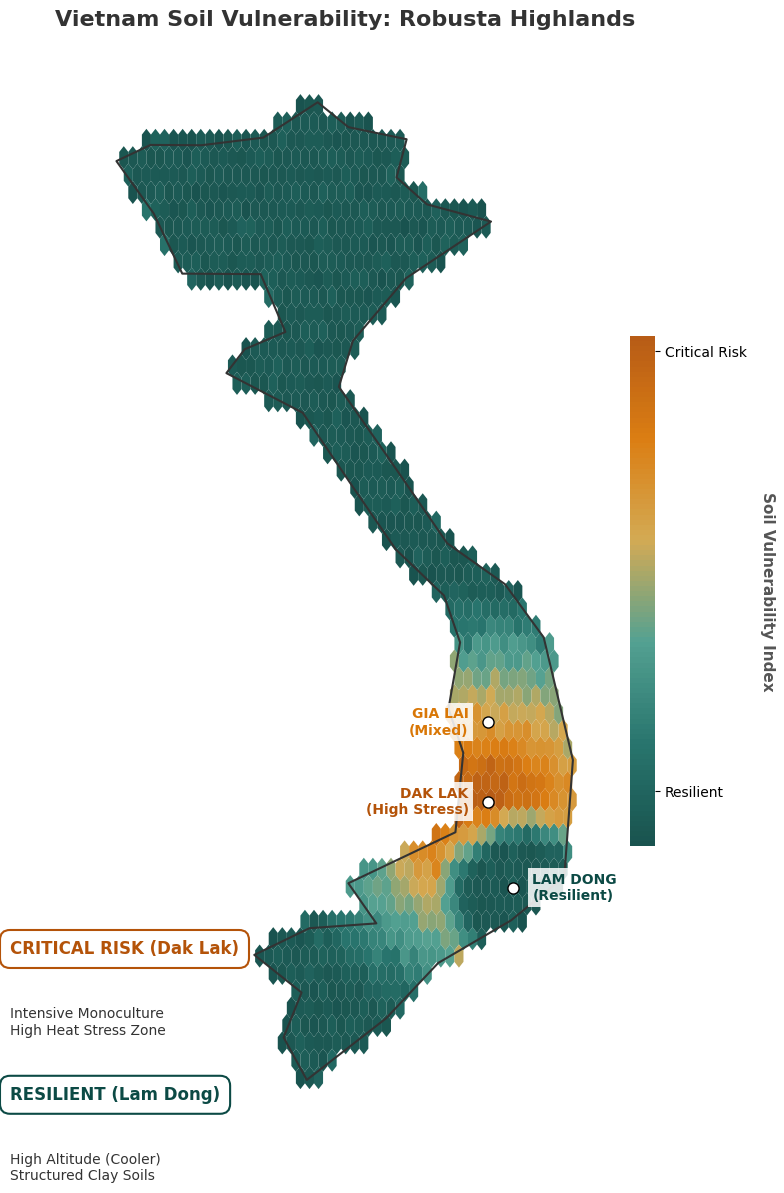
Dak Lak province (orange) shows highest risk from intensive monoculture + heat stress + depleting aquifers. Lam Dong (teal) remains resilient due to higher altitude and clay-rich soils.
Modeling Recurring Drought Events
The model looks at coffee production under recurring drought cycles based on historical El Niño frequency, which typically occurs every 2-7 years. The first illustrative year is 2024, with yield impacts modeled from the 2015-16 El Niño (the most recent extreme drought affecting coffee in both Vietnam and Brazil). We then model 2028 and 2032 droughts to demonstrate biochar's compounding value. With periodic topdressing, it protects yields across recurring crises.
Each event brings heat and water stress that can sharply reduce yields. While El Niño is a common driver, severe drought can occur outside officially classified El Niño years, so the model focuses on drought impacts rather than El Niño timing predictions.
Meta-analyses show biochar increases water-holding capacity in sandy soils by 15-20%. We assume a 1:1 correlation between water retained and yield protected, meaning 20% more available water translates to 20% yield retention during drought. This is conservative because it ignores the survival bonus: near the permanent wilting point, small increases in water availability can mean the difference between total crop failure and a viable harvest.
Like cocoa, this model focuses on drought protection value and excludes normal-year yield improvements. Research shows biochar improves yields through nutrient retention, particularly in acidic or nutrient-poor soils when co-applied with fertilizers. The actual economics would be better than what we show here.
Results: Protection Value Across Two Origins
In our 2024 drought model, biochar-amended farms maintained significantly higher yields in both regions.
Brazil (Arabica):
- Protected yield: 324 kg/ha per farm
- Value protected: ~$8.4M across 3,000 hectares
- Crisis year ROI covers deployment costs
Vietnam (Robusta):
- Protected yield: 525 kg/ha per farm
- Value protected: ~$8.5M across 3,000 hectares
- Additional benefit: Reduced need for deep irrigation infrastructure
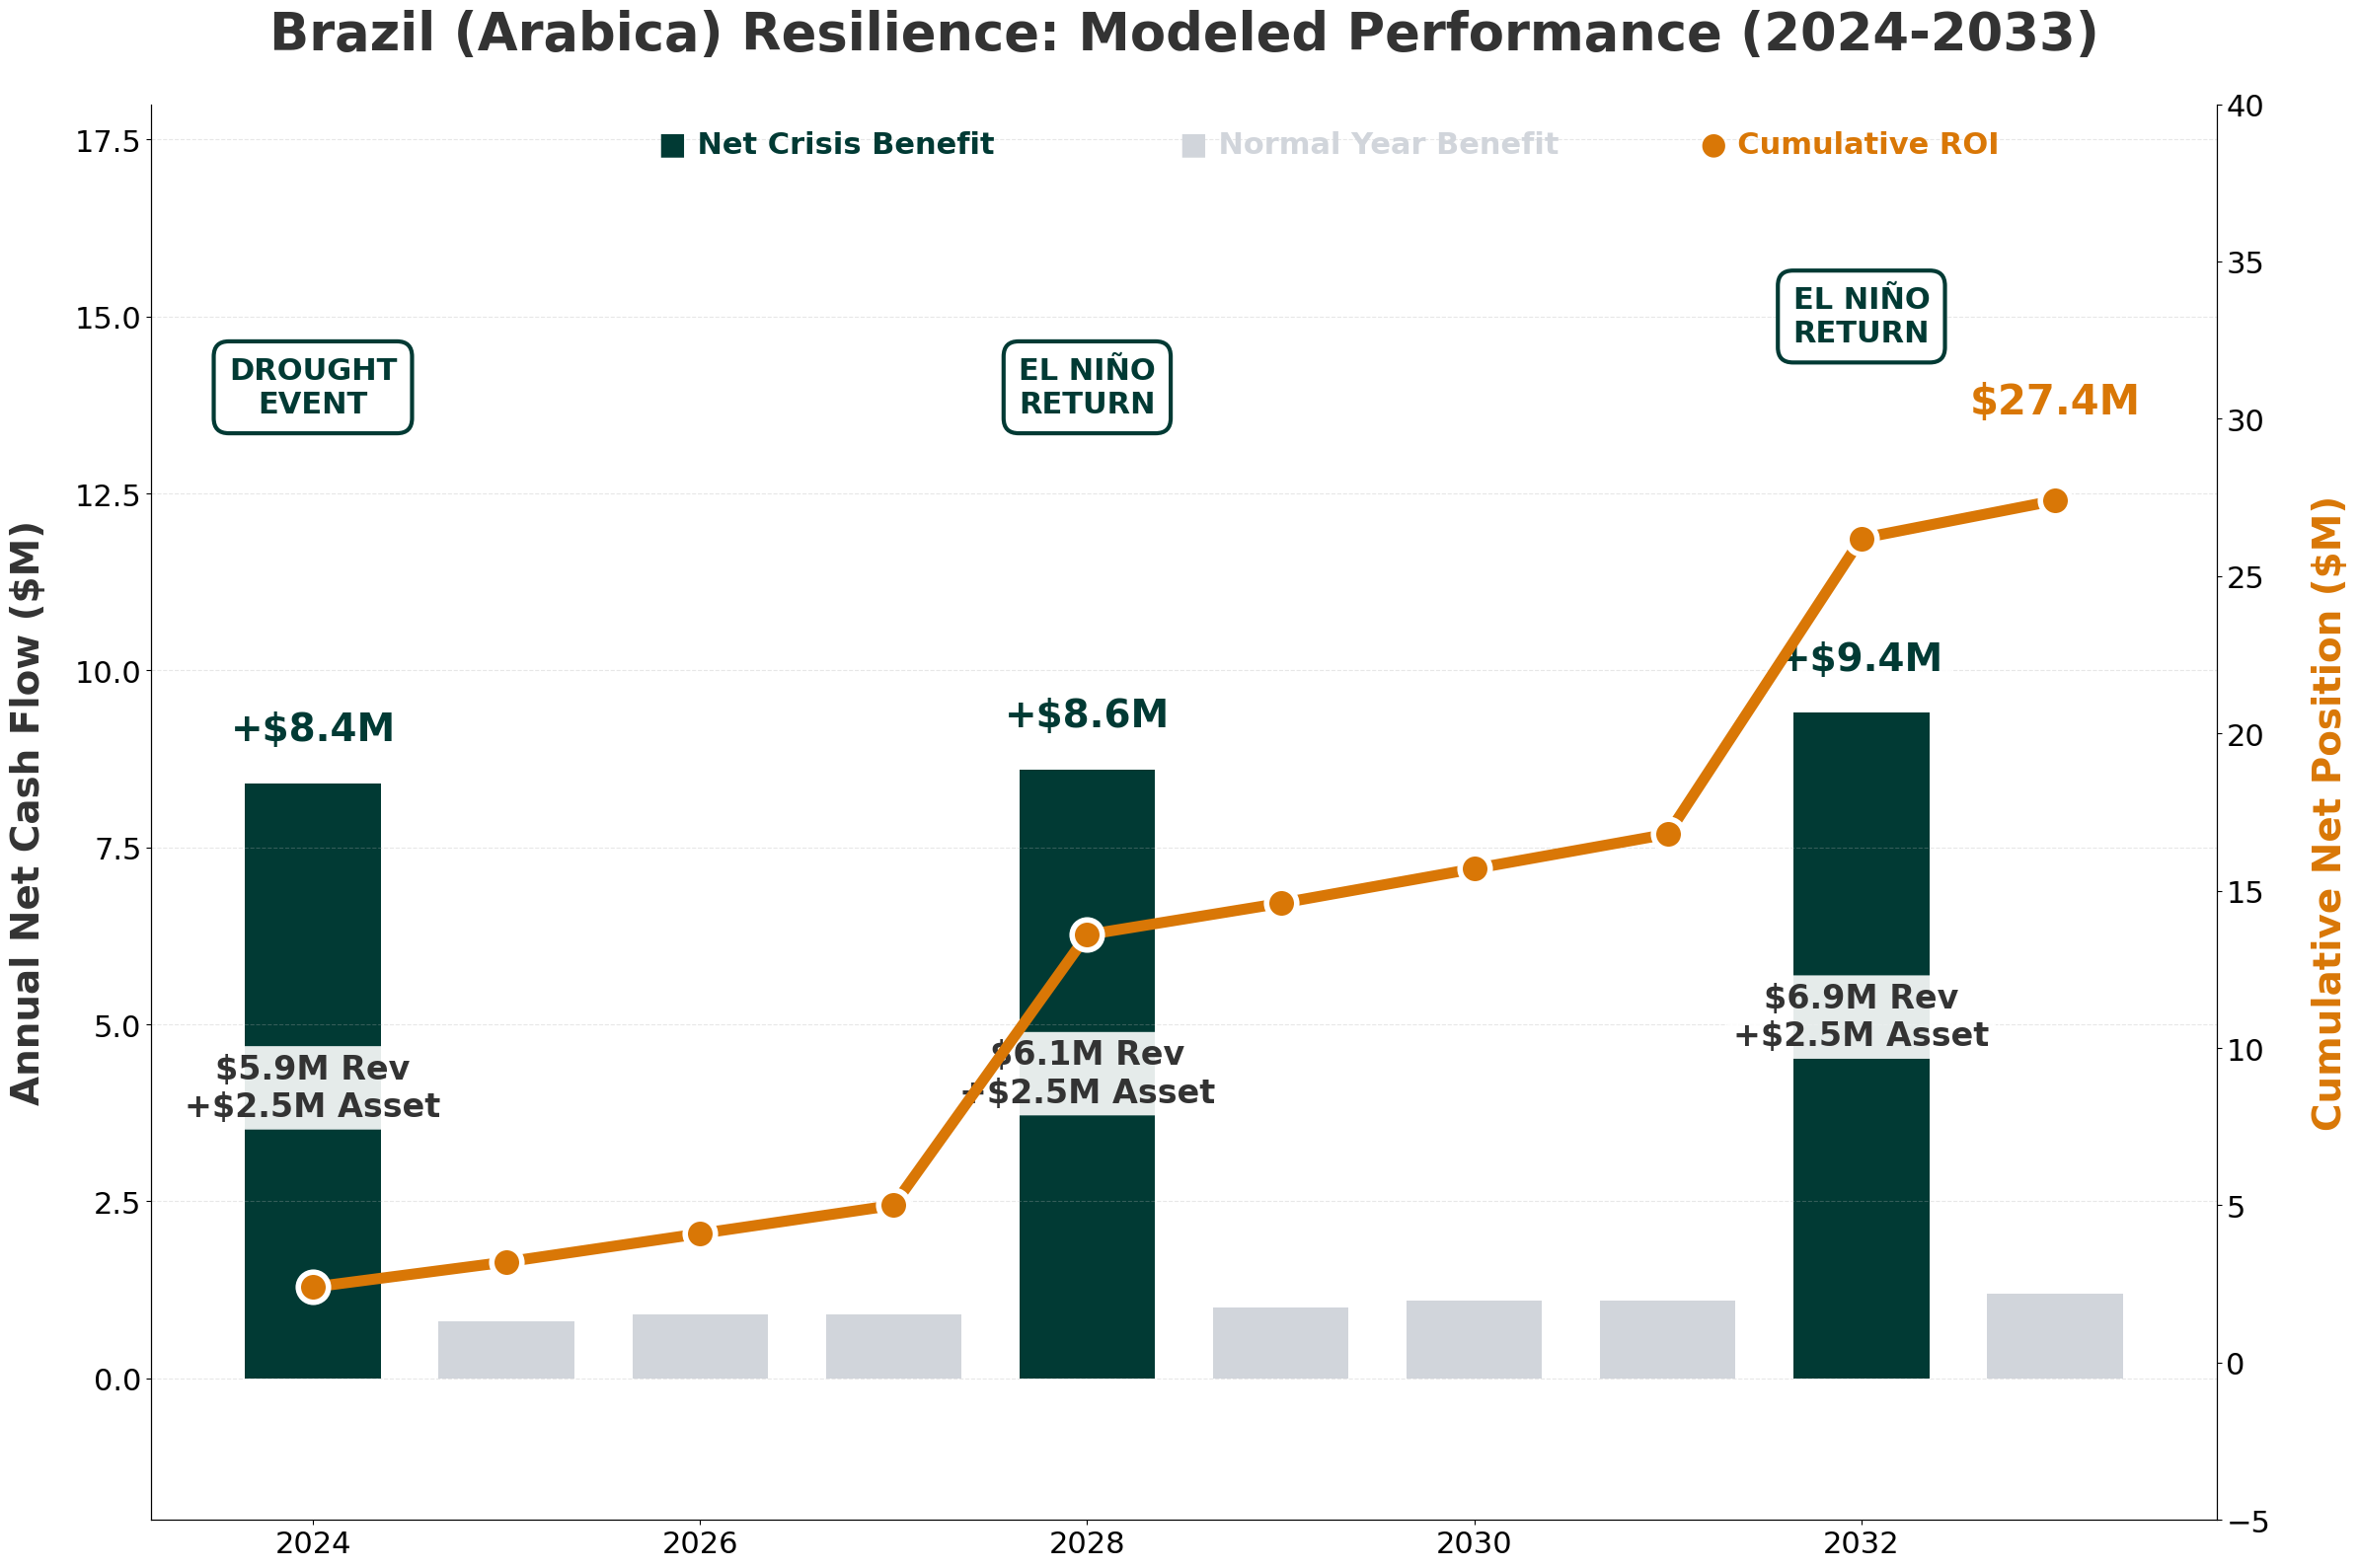
In our Brazil model, crisis years deliver $8–9M returns while normal years carry modest maintenance costs. Cumulative ROI reaches $27.4M.
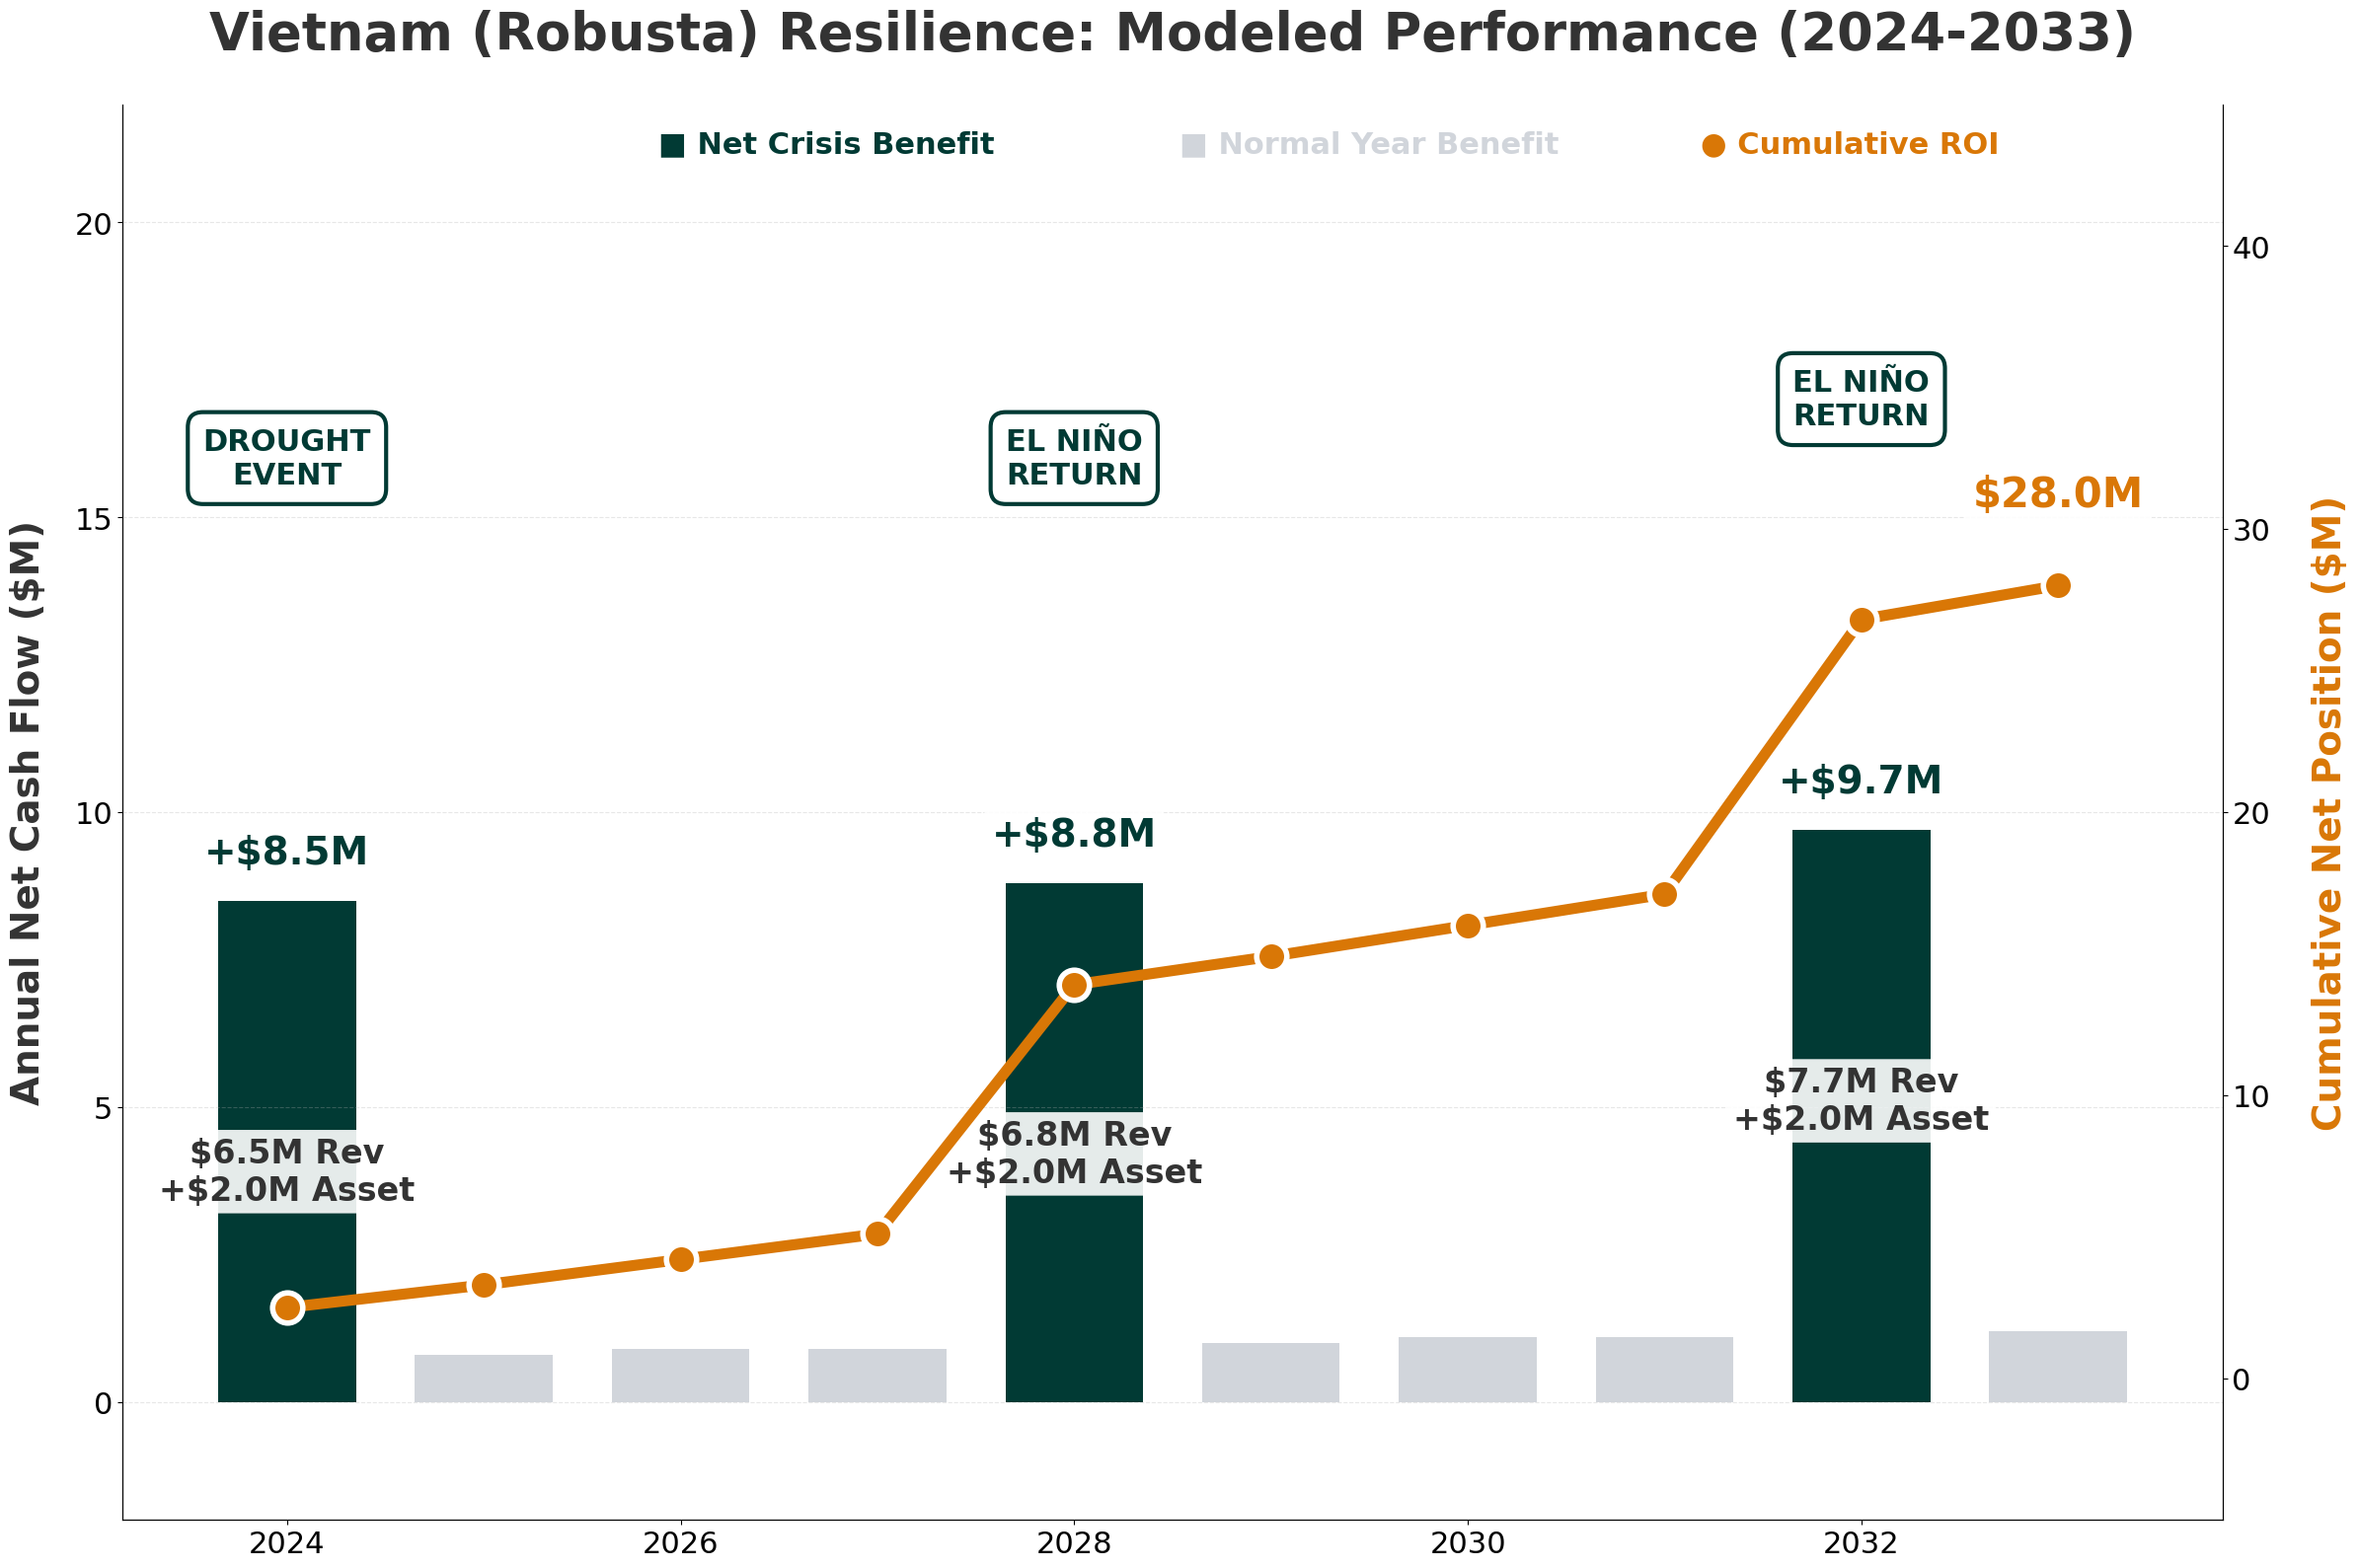
Vietnam's model shows stronger economics ($28.0M cumulative) due to higher baseline yields and intensive production systems.
Between El Niño events, rainfall returns and prices stabilize. These periods allow biochar's benefits to accumulate—soils retain moisture and fertility while maintenance costs remain low. By the next drought cycle, biochar-amended soils consistently produce while untreated soils degrade under repeated stress.
Over ten years, this compounding effect translates into cumulative returns of roughly $28M in Vietnam and $27M in Brazil. And again, this excludes normal-year yield improvements that would make the actual economics more attractive.
A quick note on the model: These numbers draw from regional averages, patterns like the 2024 El Niño, and published research. They offer a realistic view for typical conditions in Brazil and Vietnam, though every farm differs. Real results depend on your soils, practices, biochar, and drought specifics. The model emphasizes crisis-year protection only, and these are illustrative estimates—on-the-ground trials remain the gold standard.
Why Coffee Economics Are Better Than Cocoa
Coffee shows roughly double the returns of cocoa over the same time period. Three factors drive this:
Higher crop values — Coffee prices per ton are higher than cocoa, and production per hectare is higher in intensive systems, particularly in Vietnam
Flowering sensitivity — The narrow flowering win>ow creates binary outcomes (either the harvest happens or it doesn't) making drought protection extremely valuable
Compounding benefits — Coffee's perennial nature means biochar's soil structure improvements compound across multiple seasons, while degraded soils get progressively worse
Conclusion
Across multiple drought events, biochar demonstrates its value not as a one-time fix but as compounding resilience solution. By improving soil water retention and structure, it helps coffee farms withstand flowering stress, preserve harvests, and build soil health over time.
For traders and supply chain managers, understanding where and how biochar works can turn climate exposure into actionable risk management. The 2024 El Niño demonstrated what happens when soil vulnerability meets climate stress. Coffee supply chains still have time to build resilience infrastructure before the next event.
Next Steps: Strengthening Your Coffee Supply Chain
If you source tropical commodities, this model is relevant to your portfolio.
We can help you:
- Map supply chain exposure to drought-vulnerable soil zones
- Model deployment scenarios using your actual sourcing data
- Identify or develop localized biochar production facilities
- Quantify hedge value before the next El Niño cycle
Contact us to discuss how biochar deployment could help stabilize your supply chain.
APPENDIX: Modeling Methodology (Coffee Systems)
For readers who want the technical details: this section explains the model's assumptions, data sources, and calculations.
Geographic Scope & Vulnerability Mapping
Brazil (Minas Gerais, Arabica):
- Cerrado expansion corridor (Matopiba frontier + Cerrado Mineiro)
- Sandy/acidic soils with <15% clay, low organic matter
- Representative estate: 3,000 hectares
- Climate trigger: El Niño drought cycles (2024, 2028, 2032)
Vietnam (Central Highlands, Robusta):
- Dak Lak province (intensive monoculture belt)
- Sandy basalt-derived soils with depleting aquifers
- Representative estate: 3,000 hectares
- Climate trigger: El Niño drought + heat stress (>34°C during flowering)
Note: The model illustrates representative drought scenarios based on historical ENSO cycles. Actual event timing, intensity, and impacts will vary—this is not a predictive forecast. Vulnerability maps are heuristic simulations based on regional soil data (ISRIC SoilGrids) and climate patterns (NOAA El Niño indices), not farm-level satellite surveys.
Crisis Scenario Assumptions
Yield impact during crisis years:
- Brazil: 1,080 kg/ha without biochar → 1,404 kg/ha with biochar (324 kg/ha protected)
- Vietnam: 2,100 kg/ha without biochar → 2,625 kg/ha with biochar (525 kg/ha protected)
- Baseline crisis impact: 30-35% yield reduction (consistent with 2015-16 El Niño)
- Biochar effectiveness: 20-25% relative yield retention via improved water holding capacity
Normal year yields:
- Brazil: 1,710 kg/ha (conservative mid-range for Cerrado Arabica)
- Vietnam: 3,200 kg/ha (typical intensive Robusta production)
Pricing:
- Brazil crisis: $5,500/t (2024), inflated 3% annually
- Vietnam crisis: $4,100/t (2024), inflated 3% annually
- Normal pricing: ~35% below crisis levels
Asset preservation:
- Tree mortality: 20% without biochar, 2% with biochar (crisis years)
- Replanting cost: $3,600/ha (Brazil), $2,880/ha (Vietnam)
Data Sources
Climate data: NOAA El Niño Southern Oscillation (ENSO) indices, historical 2015-16 El Niño crop failure data (Vietnam), verified 2023-24 temperature anomalies and drought patterns
Soil composition: ISRIC SoilGrids 250m resolution data, regional agricultural surveys (Cerrado, Central Highlands)
Coffee pricing: ICE Futures Arabica/Robusta contracts, historical crisis pricing (2015-16 El Niño events)
Model Limitations
Representative, not prescriptive: This analysis uses regional averages and verified climate patterns to model protective value. Actual farm-level results depend on local soil conditions, management practices, biochar quality, and application rates.
Simplified crisis cycles: The model assumes El Niño events recur on a ~4-year cycle (2024, 2028, 2032). Actual ENSO patterns are variable and difficult to predict with precision beyond 12-18 months.
Binary yield model: The "crisis vs. normal" framework simplifies reality. Actual drought impacts exist on a spectrum depending on timing, duration, and intensity.
Excluded benefits: The model focuses on drought protection only and excludes normal-year yield improvements from nutrient retention, which would make the economics more attractive.